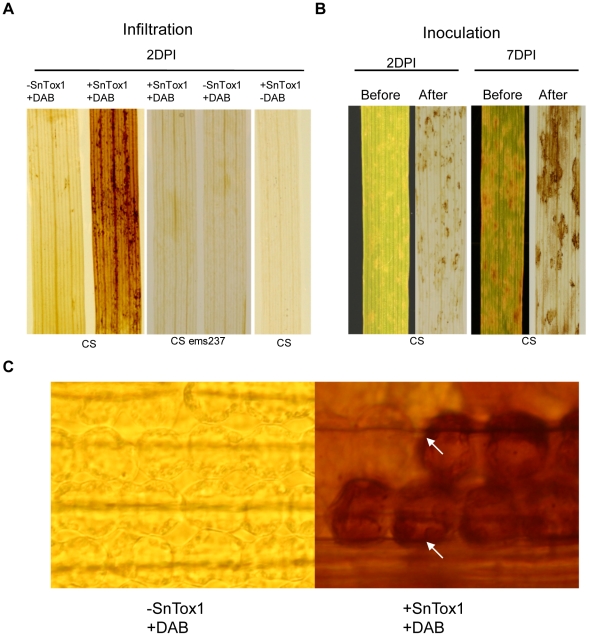
Figure 9. SnTox1 triggers H2O2 production.
A. H2O2 production in infiltrated leaves. CS (Snn1) or CS ems237(snn1) leaves were infiltrated with SnTox1 (+SnTox1) or control culture filtrates (-SnTox1) and stained with 1 mg/ml DAB (+DAB) followed by clearing of chlorophyll. Leaves infiltrated with SnTox1 were cleared without staining as a control (-DAB) to show that the toxin reaction itself does not cause the brown color. B. H2O2 production in the inoculated leaves. CS leaves were inoculated with Sn79+SnTox1A1 and collected at each day post inoculation for DAB staining followed by clearing of chlorophyll. Photograph was taken before and after DAB staining and clearing. 2 DPI and 7 DPI are shown. C. Location of H2O2 production in plant cells. The DAB-stained CS leaves were examined under the light microscope for the cellular location of DAB staining. The strong DAB staining was localized to the chloroplasts (white arrows) only in CS infiltrated with SnTox1 (400x magnification).

