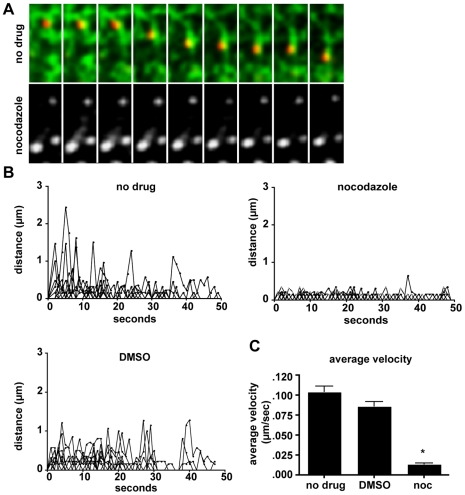
Figure 7. Movement of TC-core is microtubule dependent.
Huh-7.5 cells were electroporated with TC-core HCV RNA and at 72 hpe stained with ReAsH (red) followed by incubation with 200 nM TubulinTracker Green. Images were acquired by taking alternating 200 ms DsRed and 200 ms GFP exposures every 2 seconds. A. Top: Montage of TC-core (red) transport along microtubule (green). Elapsed time is 1 minute and the length of single frame is 9.76 µm. Below: TC-core infected cells stained with ReAsH and TubulinTracker Green and then treated with 8 ug/mL nocodazole immediately prior to imaging. Shown only is TC-core for simplicity, as there is low signal from the depolymerized microtubules. Elapsed time is 2 minutes 18 seconds. The length of the montage is 9.76 µm. B. Single particles from untreated, DMSO, or nocodazole treated cells were tracked and the distance (y-axis) versus time (x-axis) was plotted. Distance plots were constructed using ImageJ Manual Tracking plugin, which provides the instantaneous distance and velocity between two frames. Distance values were plotted versus time (x-axis). C. The average velocities of tracked particles are shown. Error bars represent standard error of mean, asterisk indicates p-value <0.0001.

