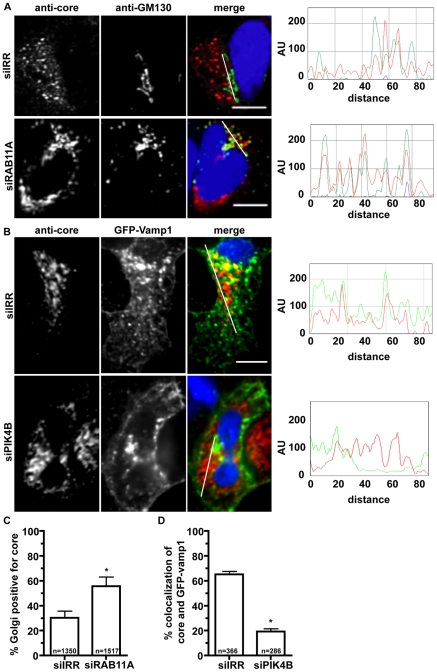
Figure 10. siRNA treatments inhibiting infectious virus production alter core sub-cellular localization.
A. Huh7.5 cells were electroporated with irrelevant (siIRR) or Rab11a (siRab11a) siRNAs followed by infection with HCV at 48 hours post electroporation. Cells were fixed and stained with Golgi marker GM130 (green) and core (red) at 72 hours post infection. Immunofluorescence of siIRR (top) and siRab11a (bottom) treated cells expressing viral core. White line in merge image is profiled for fluorescence intensity. RBG profile where distance is in pixels and fluorescence intensity is in arbitrary fluorescence units (AU). Scale bar is 10 µm. B. Huh-7.5 cells electroporated with irrelevant (siIRR) or Pik4B (siPIK4B) siRNAs, then infected with HCV at 48hpe followed by transfection with GFP-Vamp1 (green) at 72hpe. Cells were maintained for one day, then fixation and stained with anti-core antibody (red). Top: siIRR treatment. Bottom. si-PI4KB treatment. RBG profile where distance is in pixels and fluorescence intensity is in arbitrary fluorescence units (AU). Scale bar is 10 µm. C. Quantitation of core-GM130 colocalization in (A). Asterisk indicates p-value <.01. D. Quantitation of core Vamp1-GFP colocalization in (B). Asterisk indicates p-value <.0001.

