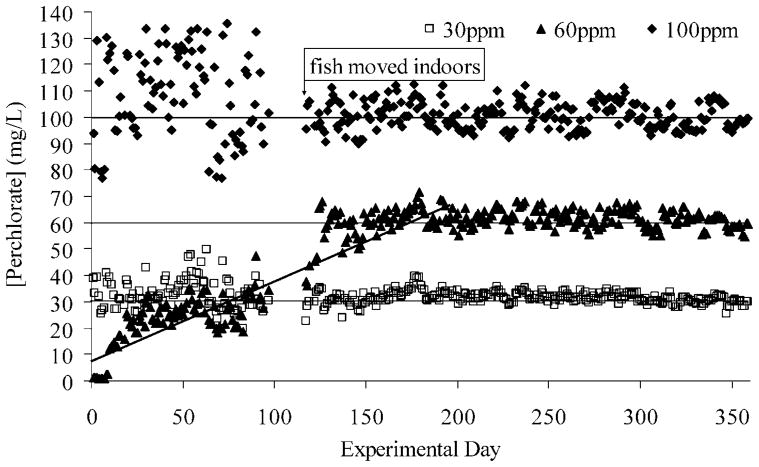
Fig. 1.
Daily perchlorate readings using the Acorn 6 perchlorate potentiometer (Oakton, Vernon Hills, IL, USA). Readings were more variable when the fish were housed outdoors, where temperatures fluctuated more than indoors. At day 100, the potentiometer broke, and it was replaced three weeks later with the same model. This period is indicated by a gap in readings. The entire data set revealed that the nominal 30 mg/L treatment had a mean perchlorate concentration of 32.00 mg/L (n = 334, SE = 0.20), and the 100 mg/L treatment had a mean perchlorate concentration of 102.92 mg/L (n = 334, SE = 0.57). The nominal 60 mg/L treatment, which mimicked the increasing perchlorate concentration noted in the year 2002, as perchlorate leached from solid rocket propellant cores (y2002 = 0.32x + 12.04, r2 = 0.92 vs y2003 = 0.31x + 9.44, r2 = 0.88), reached a maximum concentration near 60 mg/L about halfway through the experiment, after which the readings remained relatively stable (mean, 61.80 mg/L; n = 185; SE = 0.19). Values for the target dose of zero (negative controls) were less than the method detection limit of the ion chromatograph in tandem with electrospray ionization mass spectroscopy (1.1 μg/L) [19].

