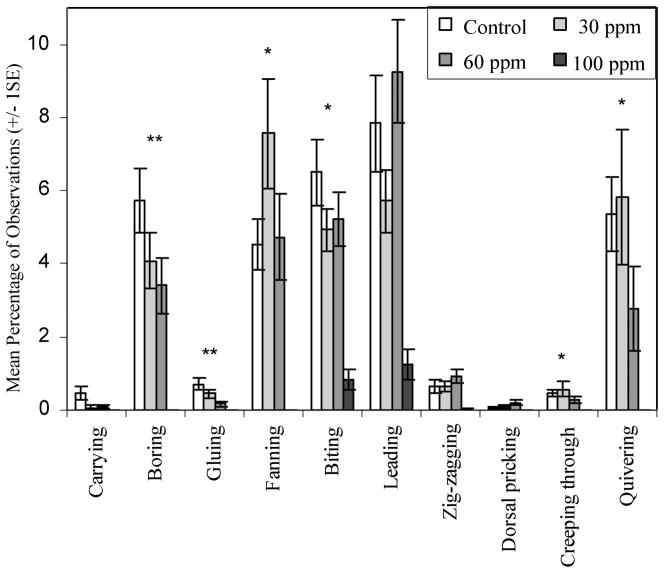
Figure 4.
Mean percentage of time spent engaged in each behaviour during courtship. Time spent in the ‘intermediate’ category is not depicted in this figure in order to highlight the other categories. Statistically significant differences (Kruskal–Wallis test, df = 3, N = 27) between treatments are depicted with asterisks (*p < 0.05, **p < 0.01).

