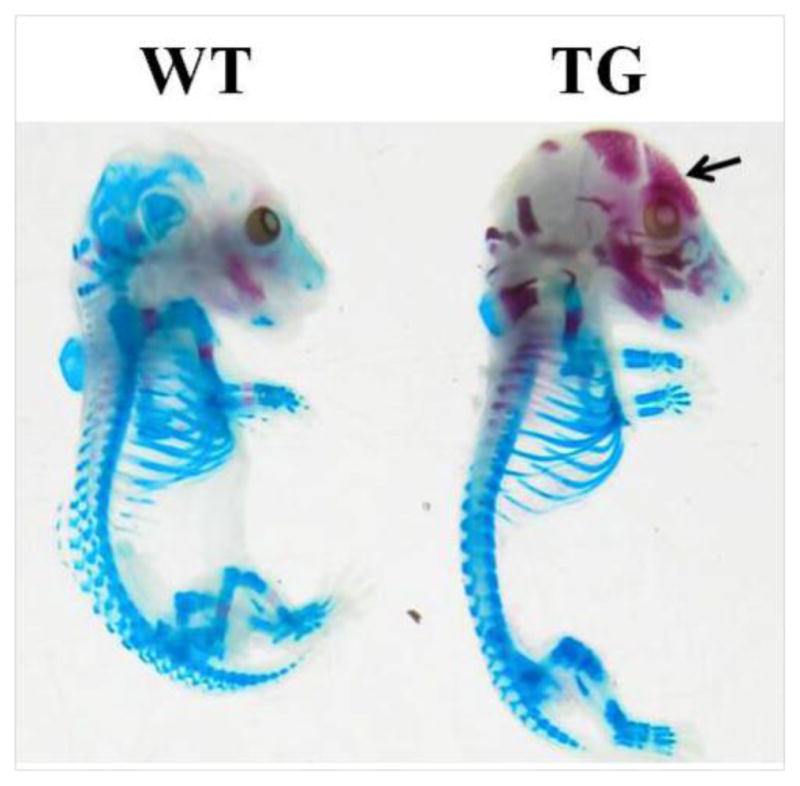
Figure 1. Comparison of ossification status at 16.5 dpc between transgenic fetuses and mice and their wild-type littermates.

Ossification center, the red area pointed by an arrow, was formed in calvarial bones of transgenic (TG) fetuses but not in calvarial bones of their wild-type (WT) littermates.
