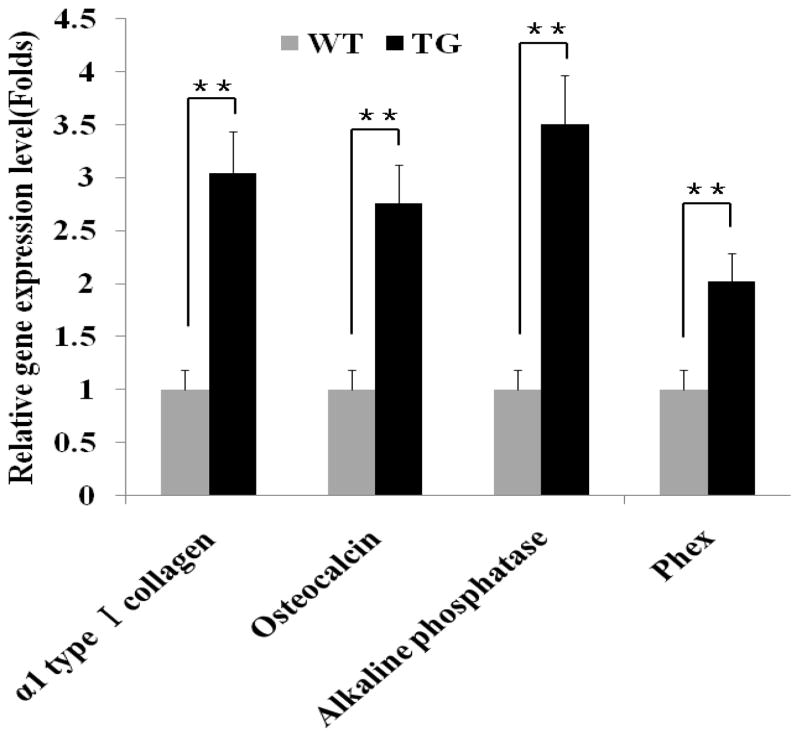
Figure 3. Comparisons of osteoblast marker expressions in skeleton of transgenic fetuses and their wild-type littermates.
WT = wild-type, TG = transgenic. N=10 in both WT and TG group. Fetal tissues were collected at 17.5 dpc. The expression levels of osteoblast marker genes in TG fetuses are presented relatively to that in WT fetuses, which are arbitrarily defined as 1 fold. Values are presented as mean ± SEM. The means between WT group and TG group differ at P<0.01(**).

