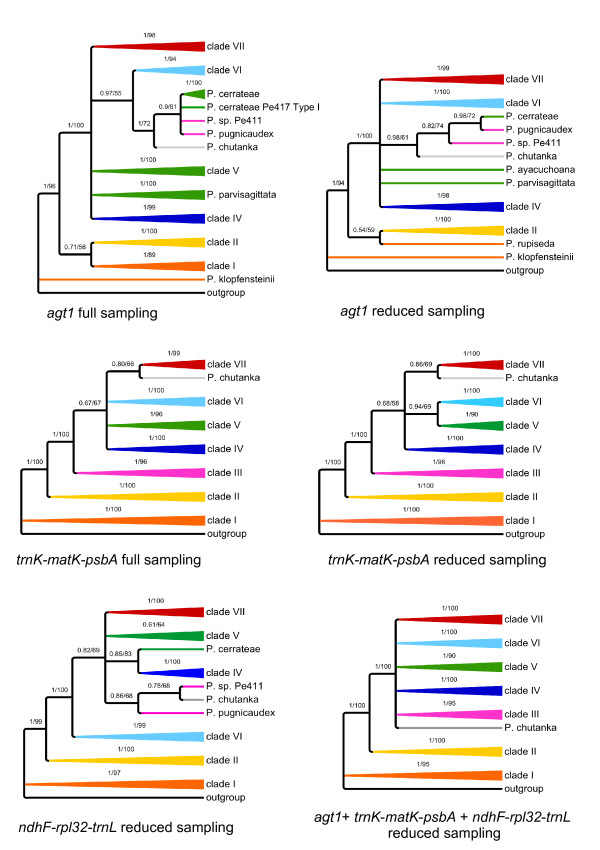
Figure 3.
Schematic summary of topologies. Summarized topologies are based on Bayesian inference. Numbers above branches are posterior probabilities (PPs) from Bayesian inference (BI) (left) and ML bootstrap values (right). Agt1 and trnK-matK-psbA are shown for both full and reduced sampling, and ndhF-rpl32-trnH for reduced sampling. Clades were named based on the topology obtained from the trnK-matK-psbA region. Full sampling reflects a 63 accession dataset, while reduced sampling comprises 26 accessions. The chloroplast regions do not provide congruent signal. From all these trees, the nuclear gene provides the best resolution with the full sampling. In this tree, an additional clade is formed, consisting of P. chutanka, P. pugnicaudex and P. cerrateae. Clade VI is sister to this new clade. These (statistically supported) relationships cannot be observed in any of the trees based on chloroplast markers.

