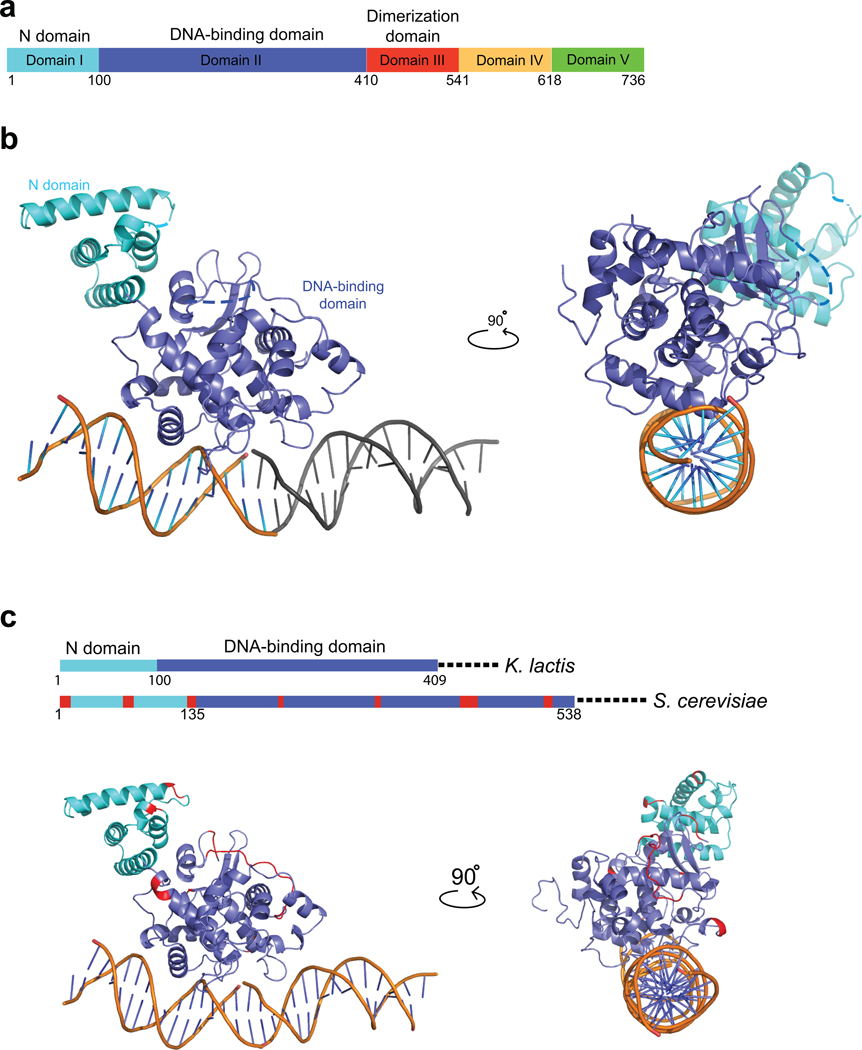
Figure 1. Domains of K. lactis Ndc10 and crystal structure of DI–II.
(a) Domain organization of Ndc10; numbers show residues at the domain boundaries derived either from limited proteolysis or from the crystal structure. (b) Structure of K. lactis Ndc10 (DI–II; 1–402) with 30 bp poly-dA:dT DNA. Domain I (N-domain, residues 1–100) is in cyan; domain II (DNA-binding domain, residues 101–402), in dark blue. Dashed lines represent disordered residues 36–39 and 283–292. A second, symmetry-related, 15 bp DNA fragment is shown in gray. The DNA has been modeled as polydA:dT (see text), with the sequence of 5’-TTAATTTATAAAATT-3’ (1–15) and 5’-AAATTTTATAAATTA-3’ (1’–15’), as indicated. (c) Sequence conservation of Ndc10 among point-centromere yeasts. Location of insertions (red) in S. cerevisiae Ndc10 DI–II with respect to K. lactis Ndc10 DI–II, shown both on a schematic representation of the primary sequence and on a ribbon representation of the structure. Illustration of all figures made with PYMOL (Delano Scientific, LLC).

