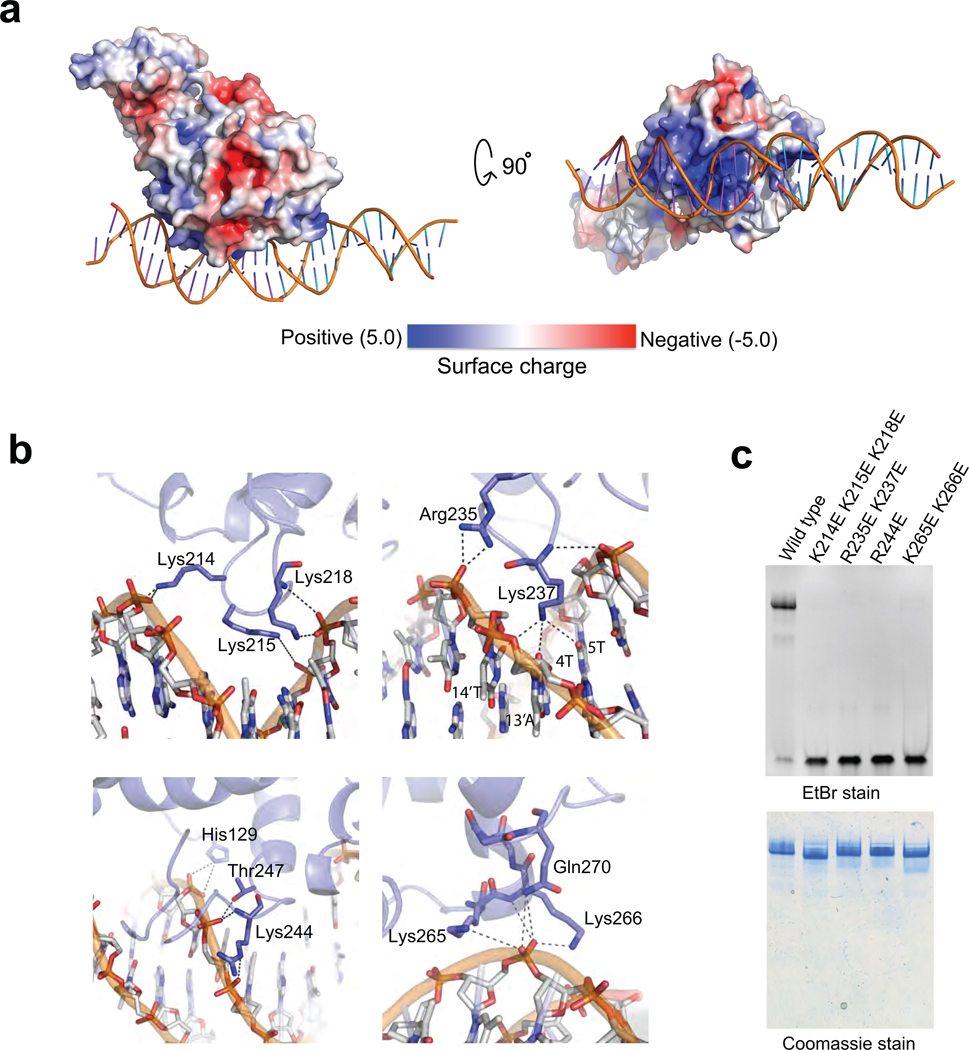
Figure 2. Surface charge distribution and DNA contacts of Ndc10 DI–II.
(a) Two views of the surface charge distribution of Ndc10 DI–II; bound DNA is shown in worm representation. (b) Sugar-phosphate backbone interactions. Residues involved in DNA contacts are labeled and shown in stick representation. (c) EMSA of wild-type and mutant Ndc10 (10% TBE acrylamide gel (w/v) stained sequentially with EtBr and Coomassie blue).

