Figure 1.
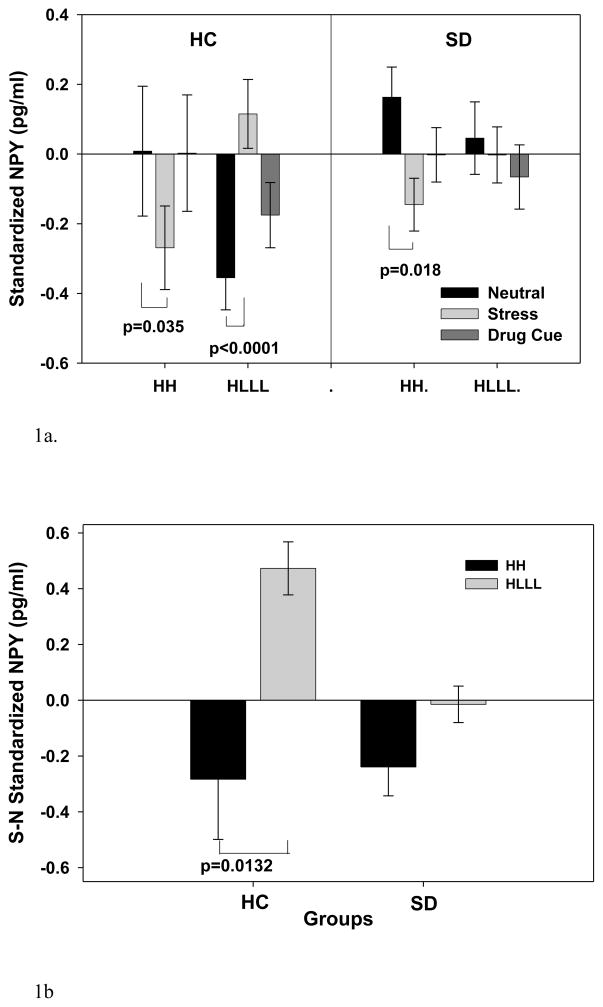
(1a) Baseline adjusted mean and SE for plasma NPY for the SD and HC groups with the HH and HLLL diplotypes (averaged across time points in each condition). The significant effect of Diplotype x Condition x Group (p=0.0206) is shown. In HC group, HH individuals showed reduced NPY (p=0.035) while HLLL individuals showed increased plasma NPY (p<0.0001) in the stress relative to neutral condition. In the SD group, HH individuals showed significantly lower NPY (p=0.0176), while HLLL individuals showed no differences in plasma NPY (p=0.703) during stress relative to neutral condition. No plasma NPY difference between diplotypes for either group was observed in the cue versus neutral conditions.
(1b) Baseline adjusted plasma NPY changes in stress (S) relative to the neutral (N) condition expressed as a subtraction in response values for neutral from the stress condition (S-N NPY) in SD and HC groups for the HH and HLLL diplotypes is shown. Relative NPY increases in the HLLL subjects but decreases in the HH subjects in the HC group (p<0.0132) is shown, but no such effect of diplotype on NPY stress response is seen in the SD group.

