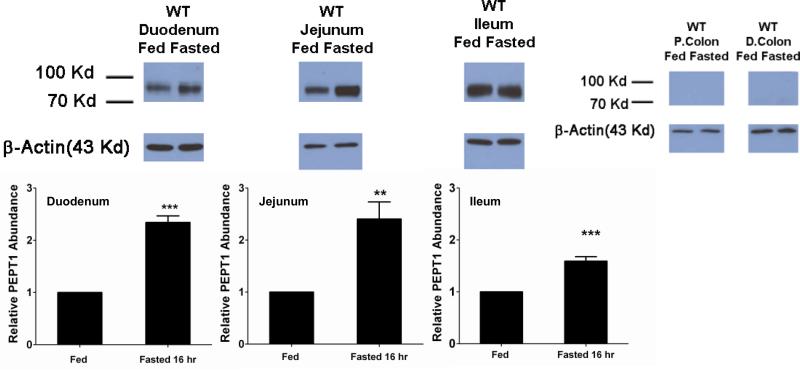
Figure 2.
PEPT1 protein expression in small intestinal and colonic segments of wild-type mice during fed and fasted conditions. For each tissue, protein expression in fed mice was considered the control group and was arbitrarily assigned a value of unity. Protein expression in fasted mice was scaled to the control value. Data are reported as mean ± SE (n=6). Statistical differences between fed and fasted conditions for each tissue segment were determined using a two-sample student's t-test; **p ≤ 0.01 and ***p ≤ 0.001. Relative protein expression levels in small intestinal and colonic segments have been reported previously (see reference 5, Fig 7).

