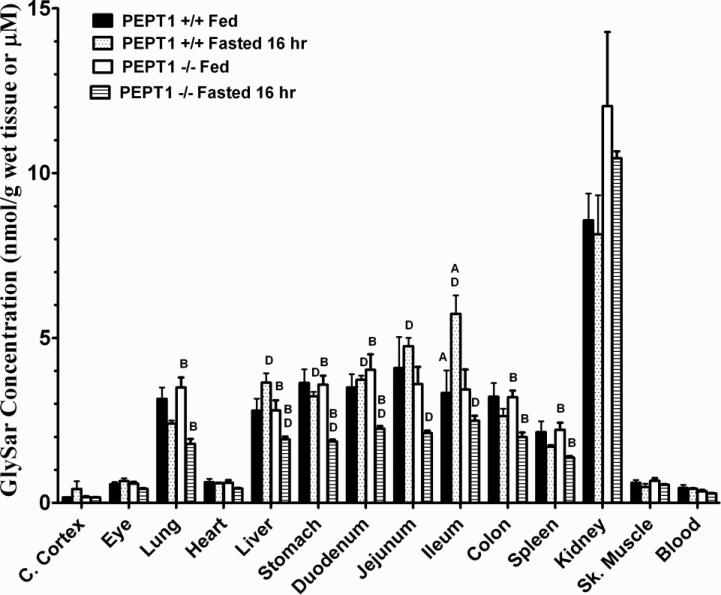
Figure 4.
Tissue distribution of [14C]GlySar during fed and fasted conditions in wild-type (+/+) and Pept1 knockout (-/-) mice, 120 min after 5 nmol/g intravenous bolus doses of dipeptide. Data are reported as mean ± SE (n=6). One-way ANOVA and Tukey method of multiple comparisons were performed to test for differences among treatment groups: ARepresents significant differences between fed and fasted conditions in wild-type mice; Brepresents significant differences between fed and fasted conditions in Pept1 knockout mice; Crepresents significant differences between wild-type and Pept1 knockout mice in fed conditions; and Drepresents significant differences between wild-type and Pept1 knockout mice in fasted conditions.

