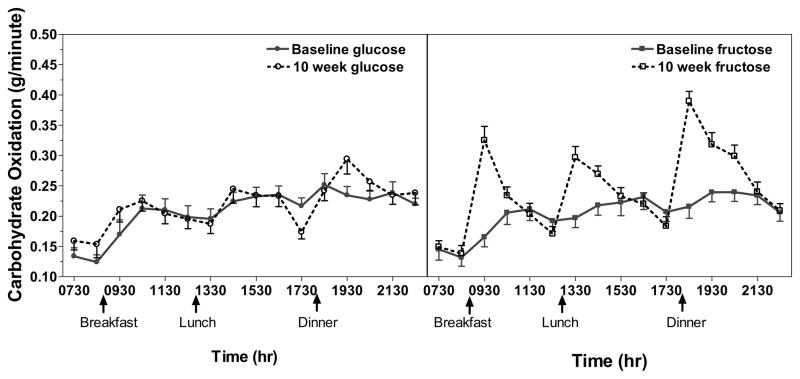
Figure 1.
Net carbohydrate oxidation rate (g/min) profiles over 15 hours for subjects consuming glucose- and fructose-sweetened beverages. Subjects consumed meals at 09:00, 13:00, and 18:00 as indicated. The first 2 data points represent resting values and the remaining 14 data points represent postprandial values. Data points represent the mean of 10-min measurements ± SEM with n=31 (fructose group n=16; glucose group n=15) for resting values and n=30 (fructose group n=15; glucose group n=15) for postprandial values.

