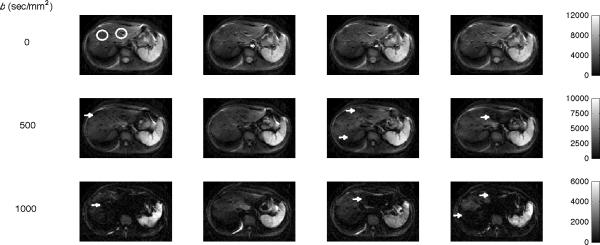
Figure 1.
Liver DW images across b-values for Subject 1. Four consecutive liver DW images obtained with b = 0 (top row), 500 (middle row), and 1000 (bottom row) sec/mm2. With no diffusion weighting (top row), all images are similar except for the different amounts of blood contained in large vessels such as the aorta. In the high b-values images, areas of patchy image dropout are seen (indicated by arrows) that worsen with increased diffusion weighting and are most pronounced in the left liver lobe. The white circles show examples of typical ROI placements.

