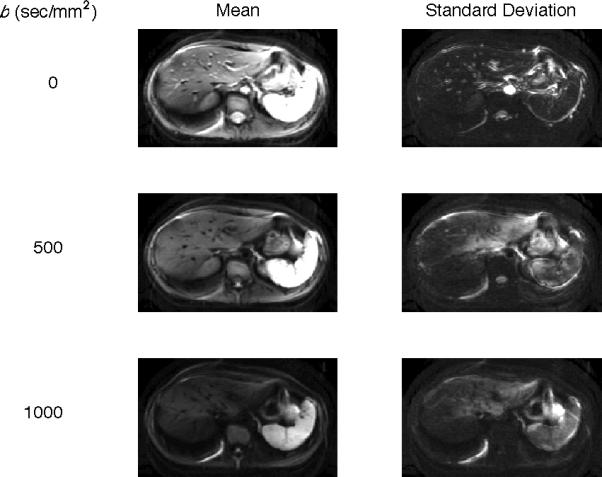
Figure 2.

Statistical maps for Subject 1 across b-values. Statistics are computed pervoxel for the 25 consecutively acquired DW images at b = 0 (top row), 500 (middle row) and 1000 (bottom row) sec/mm2. The mean signal intensity (left column) decreases with increasing b-value, consistent with DW theory. The standard deviation of the signal intensity (right column) is greatest in areas of pulsatile blood flow in b = 0 sec/mm2images and in areas proximal to the heart in the b = 500 and 1000 sec/mm2 images.
