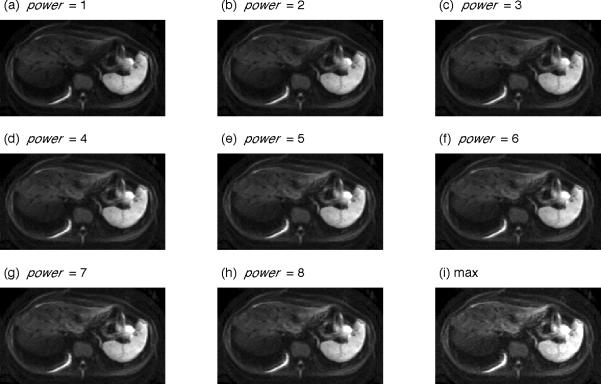
Figure 4.
p-mean images for Subject 1 computed for b=1000 sec/mm2 images. The pervoxel p-mean is computed from 10 consecutively acquired images for the indicated power values (a) – (h) and for power=∞ (i). Areas of signal loss, particularly in the left liver lobe, are lessened with increasing power value. As illustrated in the maximum image, background noise dominates at high power values.

