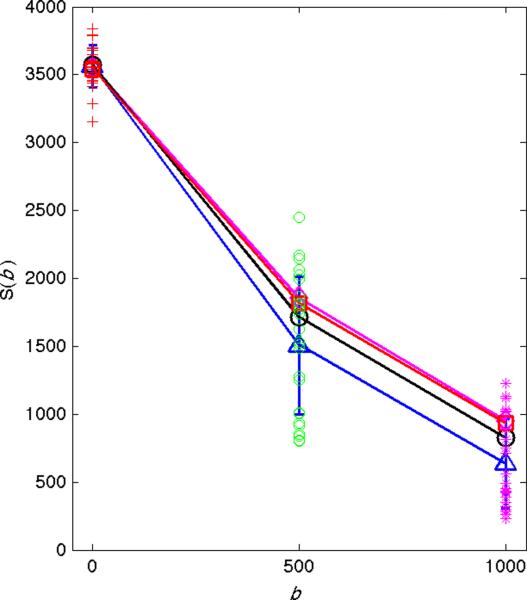
Figure 7.
Application of p-mean to DW measurements. Signal intensity (y-axis) versus b-value (x-axis) from 10 repeated measurements in the left liver lobe are shown. Standard deviations are indicated by vertical blue lines. The arithmetic means are shown by the blue triangles, the p-mean (power=4) by the black circles, the gold standard measurements by the red squares, and the p-mean of the gold standard data by the magenta diamonds. All measurements are nearly identical when there is no cardiac noise at b = 0 sec/mm2. At higher b-values the spread of the data points increases and difference between the arithmetic means and p-means increases. In all cases, the p-mean is closer to the gold standard than the arithmetic mean. Also, the p-mean of the gold standard data is almost identical to the original gold standard data, reinforcing that data without artifacts is largely unchanged by the p-mean.

