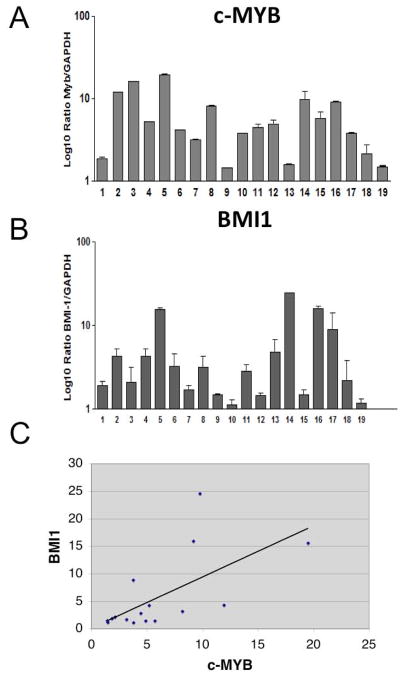
Figure 6.
c-Myb (A) and BMI1 (B) mRNA levels in BCR-ABL1-positive ALL patients. Absolute levels of c-Myb and Bmi1 mRNA were detected in blasts of BCR-ABL1-positive ALL patients by reverse transcription and SYBR green-based real-time PCR. Relative c-Myb and Bmi1 transcript levels were calculated using glyceraldehyde-3-phosphate dehydrogenase (GAPDH) expression to normalize for equivalent cDNA levels and results were expressed as ratio between c-Myb and GAPDH and Bmi1 and GAPDH. The bar graph shows the average numbers of c-Myb mRNA copies from duplicates. Error bars represent standard deviations. (*) denotes p210BCR/ABL-positive ALL samples. (C) Scatter plot represents the correlation of Myb and Bmi1 mRNA levels in p190BCR/ABL-positive ALL samples.

