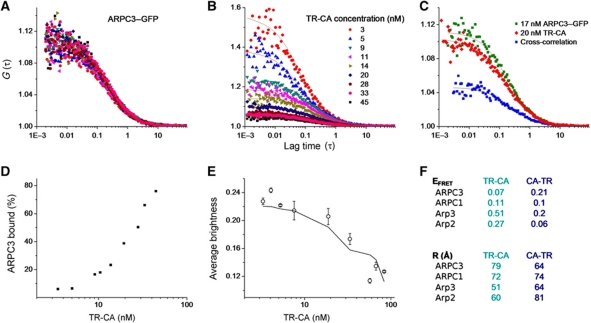
Figure 4.
Methods and results for FRET measurement between Arp2/3 subunits tagged with GFP and TR-labelled CA peptide. (A–C) FCCS with 488 nm excitation for eGFP and 561 nm excitation for TR was used to measure the percentage of Arp2/3 complex bound with peptide at a range of peptide concentrations. As an example, representative curves are shown for ARPC3–GFP (A) titrated with TR-CA at the concentrations indicated in (B). The concentration of ARPC3–GFP was held constant (B). FCS curves of TR-CA are shown at the concentrations labelled. In FCS, the amplitude of the autocorrelation curve is inversely proportional to concentration. At each concentration of TR-CA, the cross-correlation was calculated between ARPC3–GFP and TR-CA. An example cross-correlation curve is shown in blue (C) for the concentrations of TR-CA and ARPC3–GFP. (D) The relative amplitude of the cross-correlation compared with the autocorrelation curves (example in C) is used to calculate the percentage of ARP2/3 bound to peptide at each peptide concentration. Representative data are shown for ARPC3–GFP titrated with TR-CA. (E) At each concentration of the TR-labelled peptide, after the FCCS measurement, the 561-nm laser was turned off and eGFP data were acquired and fit with moment-based brightness analysis. The curve of average brightness of each GFP-labelled Arp2/3 complex as a function of fraction bound to labelled CA was fit to extract bound (quenched) and unbound (unquenched) brightness of GFP, which was converted to FRET efficiency. Representative data are shown for Arp3–GFP titrated with TR-CA, which are the pair with the highest FRET. (F) Tables showing FRET efficiency (top) and corresponding distances (bottom) between the C-terminal GFP of indicated subunits and TR at C- or N-terminus of the CA peptide.

