Figure 8.
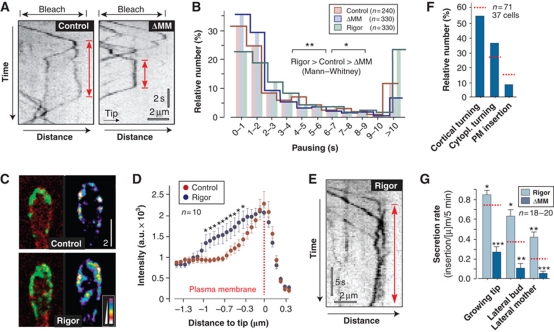
The MMD of Mcs1 controls apical residence time of Mcs1-bound vesicles. (A) Kymographs showing motility of G3Mcs1 (control) and G3Mcs1ΔMM (ΔMM) in photo-bleached buds. In both strains, arriving vesicles pause (red arrows). Time is given in seconds; distance is given in micrometers. The images were contrast inverted. (B) Graph showing the apical residence time for G3Mcs1 (control), the MMD truncated G3Mcs1ΔMM (ΔMM) and a rigorously binding mutant protein G3Mcs1rigor (rigor). Statistical significance was tested using an unpaired t-test with Welch's correction. Single asterisk indicates statistical significance to control at P<0.05 and double asterisks indicate statistical significance to control at P<0.01. All bars are given as mean±s.e.m., sample size n is indicated. (C) Images of G3Mcs1 in buds in control cells and cells expressing a fluorescent mcs1 rigor protein (rigor). In control cells, G3Mcs1 (left panel, green) localizes predominantly in the plasma membrane (mChSso1, red). In mutants, G3Mcs1rigor is also concentrated at the cortical cytoplasm (left panel, rigor). This localization is best visible in false-coloured images, where signal intensities are represented by colours (right panels). Bar represents micrometers. (D) Graph showing average signal intensity profiles for cells expressing either G3Mcs1 (control) or G3Mcs1rigor (rigor). Statistical significance was tested using an unpaired t-test with Welch's correction. Asterisks indicate statistical significance to control at P<0.05. All bars are given as mean±s.e.m., sample size n is indicated. (E) Kymographs showing motility of G3Mcs1rigor (rigor) in photo-bleached buds. Red arrow indicates pausing. Time is given in seconds; distance is given in micrometers. Image was contrast inverted. (F) Bar chart showing the behaviour of Mcs1-carrying vesicles at the growing bud in mutants that lack the myosin-17 MMD. Most vesicles turn around (‘cortical turning’ and ‘cytoplasmic turning’). Only few signals were inserted into the plasma membrane (membrane insertion). Control values are indicated with dotted red lines (see Figure 3F). Note that compared with control cells, the secretion rate in ΔMM cells is reduced by ∼40%. Sample size n is given. (G) Bar chart showing the recovery of G3Mcs1ΔMM (ΔMM) and G3Mcs1rigor (rigor) signals in the plasma membrane after local photo-bleaching. Statistical significance was tested using an unpaired t-test with Welch's correction. Single asterisk indicates statistical significance to control (see Figure 3H and dotted red lines) at P<0.05, double asterisks indicate statistical significance to control at P<0.01, and triple asterisks indicate statistical significance to control at P<0.0001. All bars are given as mean±s.e.m., sample size n is indicated. Note that tightly binding of G3Mcs1rigor to cortical actin increases secretion, suggesting that Mcs1 tethers vesicles at the plasma membrane rather than transporting them along cortical actin.

