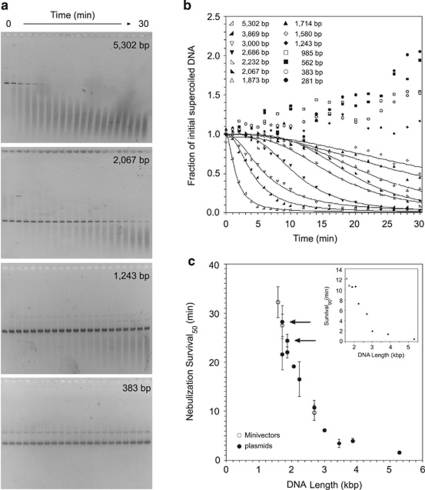
Figure 1.
DNA survival during nebulization as a function of DNA length. (a) Representative gels of DNA vectors subjected to nebulization as sampled from the reservoir. (b) Graphical representation of DNA shearing as a function of length (averaged for at least three separate experiments). The curves represent the fit to a sigmoidal function (Supplementary Table 1). Minivectors ⩽1243 bp were not fitted because after 30 min the intact DNA did not decrease. Nebulization survival times were determined for each DNA vector. (c) The time at which 50% of the vector survived (Survival50). Each Survival50 value is the mean from at least three separate experiments. Error bars represent the standard deviation. The arrows denote Survival50 of the two plasmids, pDJC1 and pQR499, that were propagated in LZ54. Minivectors are represented by open circles and plasmids are shown as closed circles. The inset shows Survival90 values, which is the time at which 90% of vectors remained.

