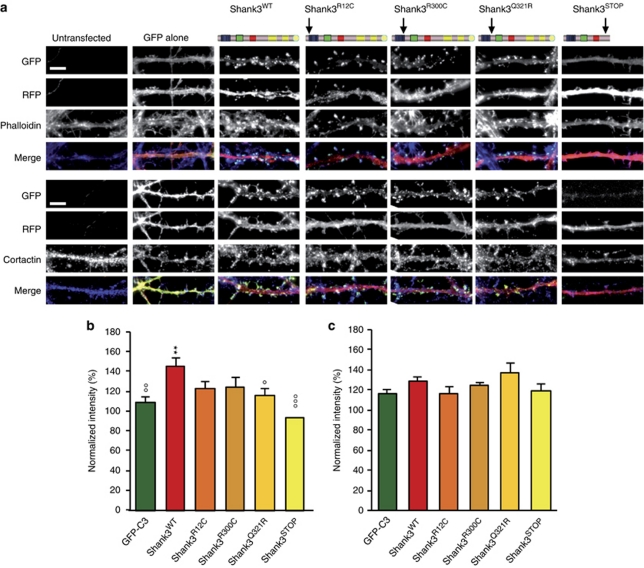
Figure 3.
Effects of Shank3WT and mutants on F-actin and cortactin levels in spines. (a) Immunofluorescence microscopy of hippocampal neurons at DIV21 transiently co-transfected with green fluorescent protein (GFP)–Shank3WT or mutated forms and red fluorescent protein. Neurons are stained with anti-GFP and anti-DsRED. F-actin was visualized with phalloidin 647. Cortactin is visualized with anti-cortactin (blue). Scale bars represent 6 μm. (b, c) Quantification of changes in the synaptic staining intensity of F-actin or cortactin induced by the overexpression of Shank3WT or the mutated forms. (**P<0.01 compared with the control; °°°P<0.001, °°P<0.01 and °P<0.05 compared with Shank3WT).

