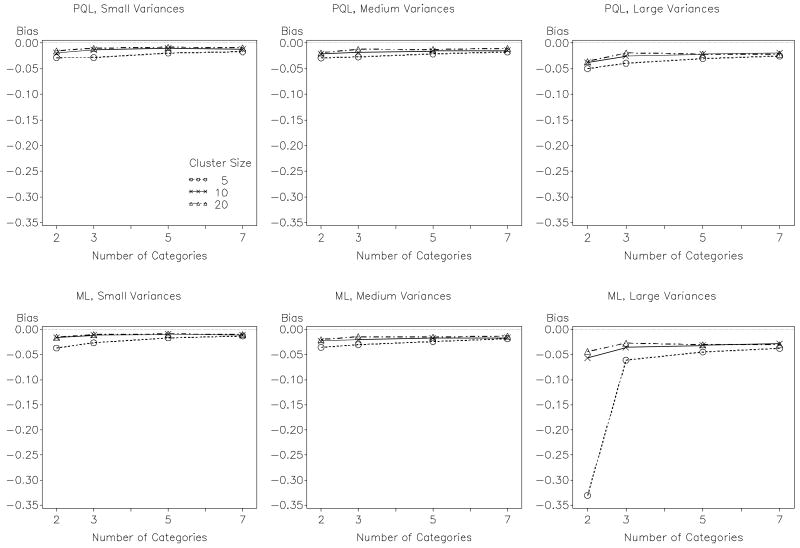
Figure 5.
Average bias for the standard errors (SE) of the three fixed effect estimates (excluding thresholds) across number of outcome categories and cluster size. Notes. Results are plotted for multilevel cumulative logit models; PQL denotes Penalized Quasi-Likelihood and ML denotes Maximum Likelihood with adaptive quadrature. This plot does include linear multilevel model conditions.

