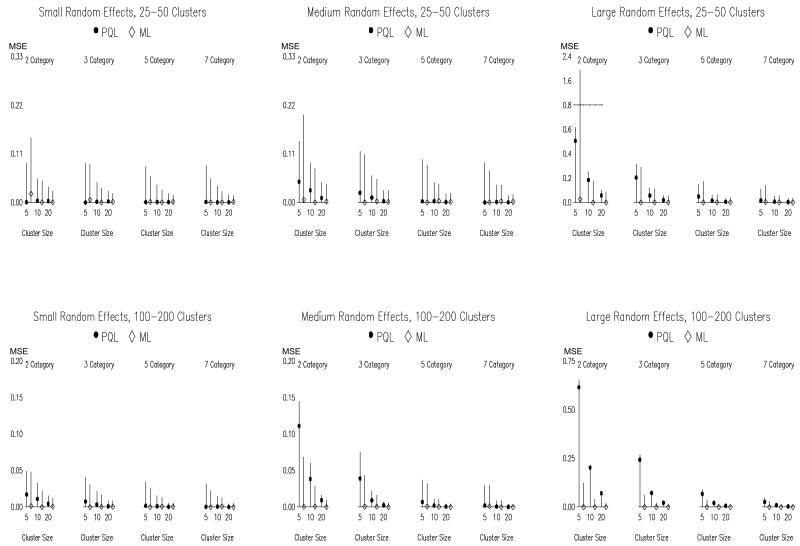
Figure 7.
Mean-Squared Error (MSE) for the standard deviation of the random slope, across number of outcome categories, number of clusters, and cluster size. Notes. The scale differs across panels and is discontinuous in the upper right panel. See Figure 4 notes for definition of quantities in this plot.

