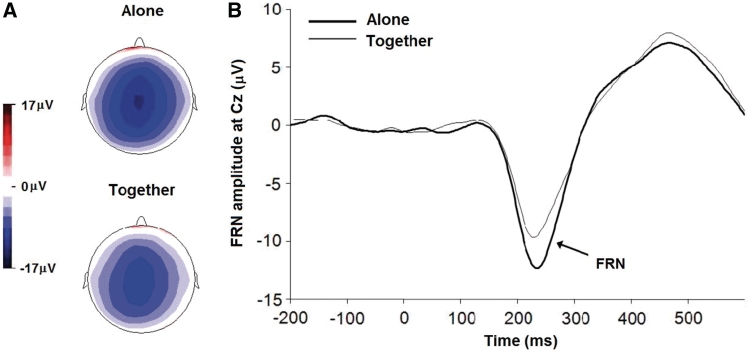
Fig. 1.
Topographic maps and waveforms depicting the FRN. (A) Group average topographic maps of the FRN period during the alone (top) and together (bottom) condition; (B) group averaged ERP waveforms at Cz from 200 ms before to 600 ms after the presentation of wall feedback during the alone (heavy line) and together (light line) condition.

