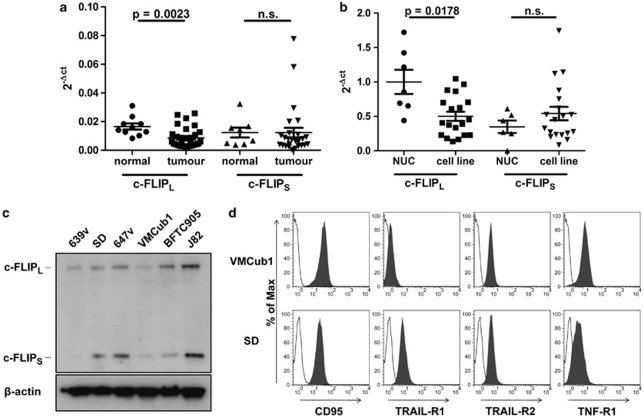
Figure 1.
(a) Quantification of c-FLIPL and c-FLIPS mRNA levels in normal urothelial tissues (normal; n=10) and urothelial carcinoma samples (tumour; n=28) by real-time RT-PCR. Values were normalised to GAPDH expression. Horizontal lines represent the mean; error bars display the standard deviation. Statistical analyses were performed by two-tailed Mann–Whitney U-tests. (b) Quantification of c-FLIPL and c-FLIPS mRNA levels in NUCs (n=7) and urothelial cell lines (cell line; n=19) by real-time PCR. Values were normalised to TBP expression levels. Horizontal lines represent the mean; error bars display the standard deviation. Statistical analyses were performed by two-tailed Mann–Whitney U-tests. (c) Western blot analysis of c-FLIP protein expression in the indicated urothelial cell lines. β-Actin was used as the loading control. (d) VMCub1 and SD cell surface expression of the death receptors CD95, TRAIL-R1, TRAIL-R2 and TNF-R1 analysed by flow cytometry. Unstained cells are shown in white

