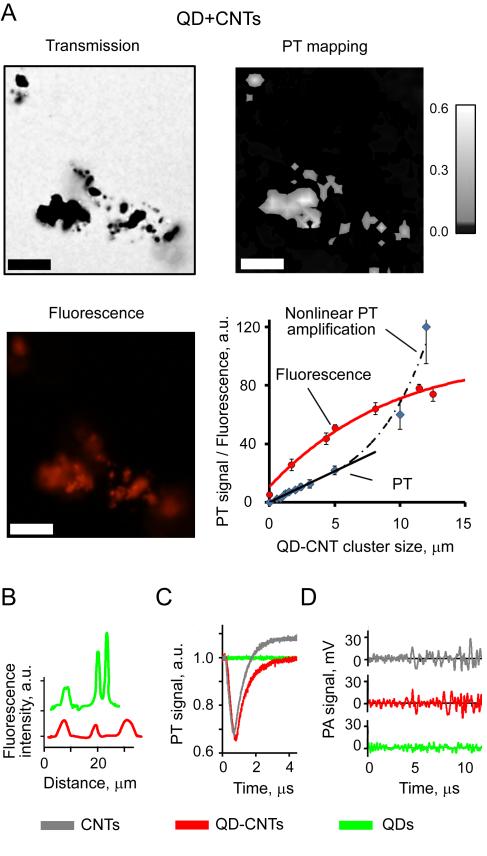
Figure 4.
In vitro detection and imaging of individual QDs, CNTs, and QD-CNTs. (A) Transmission (enhanced contrast), PT, and fluorescent imaging of QD-CNTs. Laser parameters: energy fluence of 0.05 J/cm2, wavelength 903 nm, scan step 1 μm. Scale bar – 5 μm. Exposure of fluorescence imaging 200 ms. (B) Line profile for fluorescent intensity of 5 μm QD and QD-CNT clusters. (C) PT and (D) PA signals from ~1 μm QD, CNTs, and QD-CNT clusters: 903 nm, 0.05 J/cm2.

