
Figure 2.
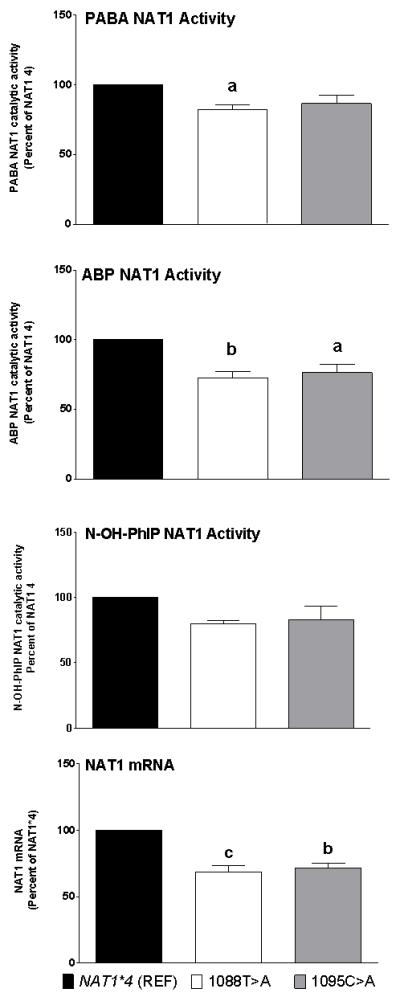
Effects of 1088T>A and 1095C>A on NAT1 activities towards PABA and ABP N-acetyltransferase, and N-OH-PhIP O-acetyltransferase activities and NAT1 mRNA. Each bar represents Mean ± SEM for three transfections. a) p<0.05; b) p<0.01; c) p<0.001 significantly different from the NAT1*4 reference.