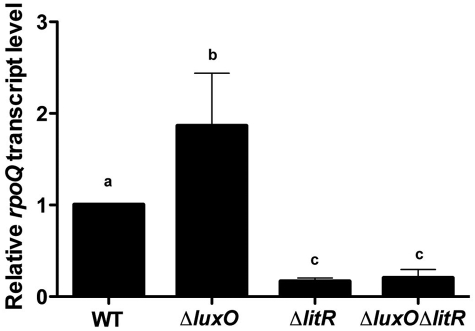
FIG 3 .
qRT-PCR analysis of rpoQ expression in V. fischeri strains MJM1100 (wild type [WT]), TIM305 (ΔluxO), TIM358 (ΔlitR), and TIM355 (ΔluxOΔlitR). The strains were grown in LBS medium and harvested at an OD600 of 0.5. The transcript levels of rpoD were used as a normalizing control. Data are relative to wild-type levels, set at 1.0. Graphical and error bars indicate the averages and standard deviations of data from three independent experiments, respectively. Shared letters above the bars indicate no statistically significant difference (P > 0.05), whereas different letters indicate that there is a significant difference (P < 0.01) in rpoQ transcript levels between those strains (analysis of variance [ANOVA] and Tukey’s honestly significant difference [HSD] test).

