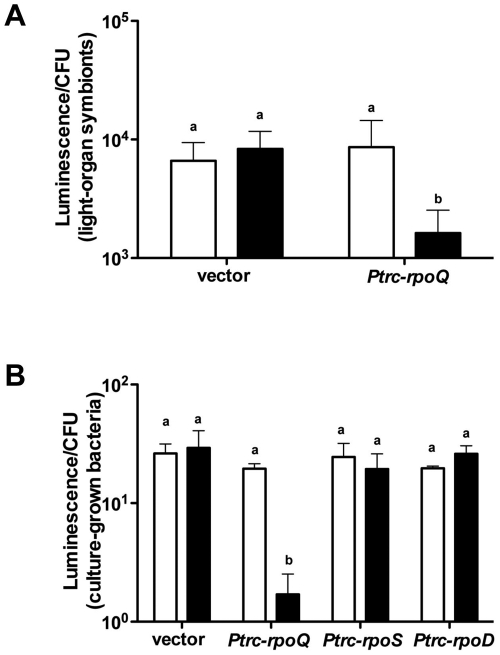
FIG 5 .
The impact of RpoQ on luminescence. (A) Squid luminescence (per CFU) of wild-type V. fischeri cells harboring either pTM214 (vector) or pXDC10 (Ptrc-rpoQ) in the presence (black bars) or absence (white bars) of 1 mM IPTG. Graphical and error bars indicate the averages and standard deviations. One representative experiment performed in triplicate is analyzed. (B) Culture luminescence per CFU of wild-type MJM1100 harboring pTM214 (vector), pXDC10 (Ptrc-rpoQ), pXDC35 (Ptrc-rpoS), and pXDC36 (Ptrc-rpoD), with (black bars) or without (white bars) IPTG addition. Graphical and error bars indicate, respectively, the averages and standard deviations, respectively, of data from three independent experiments. Shared letters above the bars indicate no statistically significant difference (P > 0.05), whereas different letters indicate a significant difference (P < 0.001 in panel A and P < 0.05 in panel B) between the luminescence levels (ANOVA and Tukey’s HSD test).

