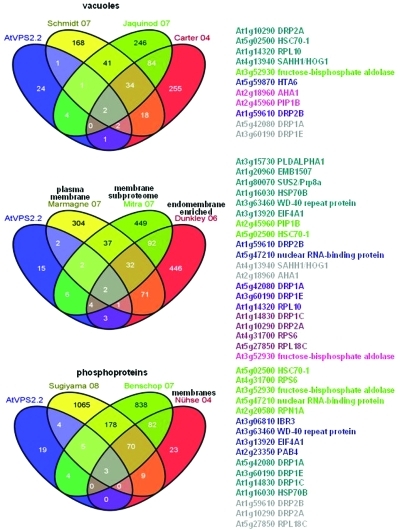
Figure 4.
Subcellular localization of AtVPS2.2 interacting proteins. Venn diagrams of the overlap between AtVPS2.2-GFP interactors and (phosphor-) proteins that have been isolated from membranes and vacuoles. The colored AGI codes of the proteins correspond to the overlapping sectors. The first authors of the publications used for comparison are also color coded.

