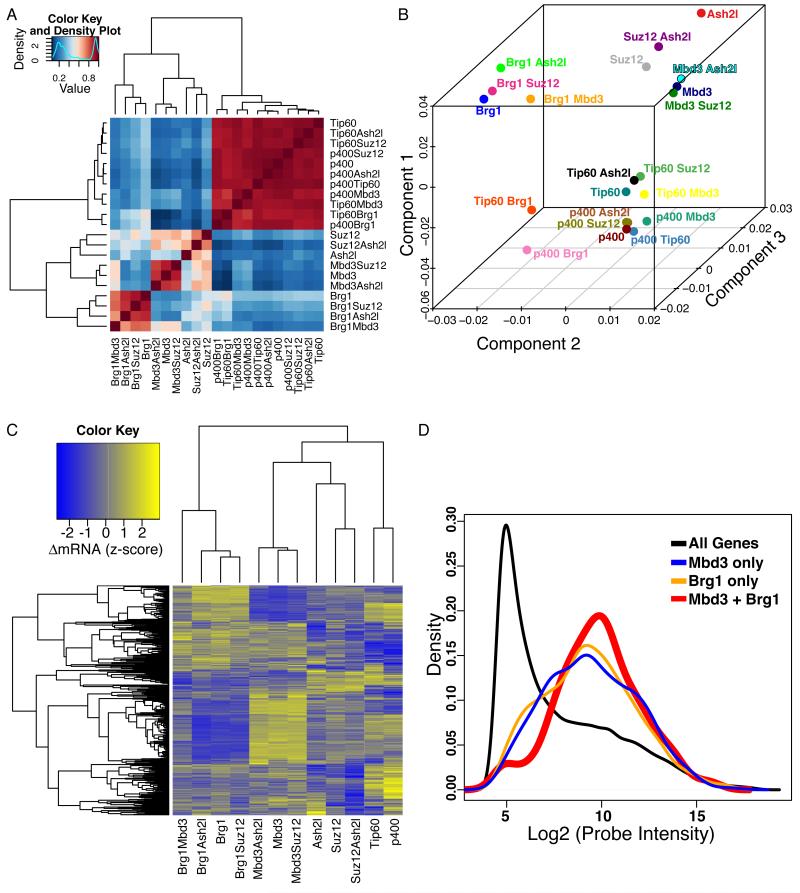
Figure 1. Antagonistic effects of Brg1 and Mbd3 on gene expression in mES cells.
(A) Gene expression data for single and double knockdowns of Brg1, Mbd3, Ash2l, Suz12, p400, and Tip60. Heatmap shows pairwise Pearson correlation coefficients for the 21 datasets. Four major clusters emerge, roughly corresponding to Brg1, Mbd3, Ash2l/Suz12, and Tip60/p400.
(B) Principal Component Analysis. Genes significantly misregulated (adjusted p-value < 0.01) in any data set from (A) were subjected to principal component analysis. Shown are individual data sets plotted along three most prominent principal components, which account for 87% of the total variance in gene expression.
(C) Mbd3 and Brg1 antagonistically regulate a common set of genes. Unsupervised clustering of genes misregulated in both the Mbd3 KD and Brg1 KD datasets (adjusted p-value < 0.05). Clustering was performed on data sets containing either Mbd3 KD or Brg1 KD (or both), as well as the Tip60, p400, Suz12 and Ash2l single KD datasets for contrast.
(D) Genes regulated by both Mbd3 and Brg1 tend to be moderately to highly expressed. Shown are mRNA abundance distributions (expressed as log2 of microarray probe intensity) for all genes, and for genes regulated by either or both Mbd3 and Brg1.

