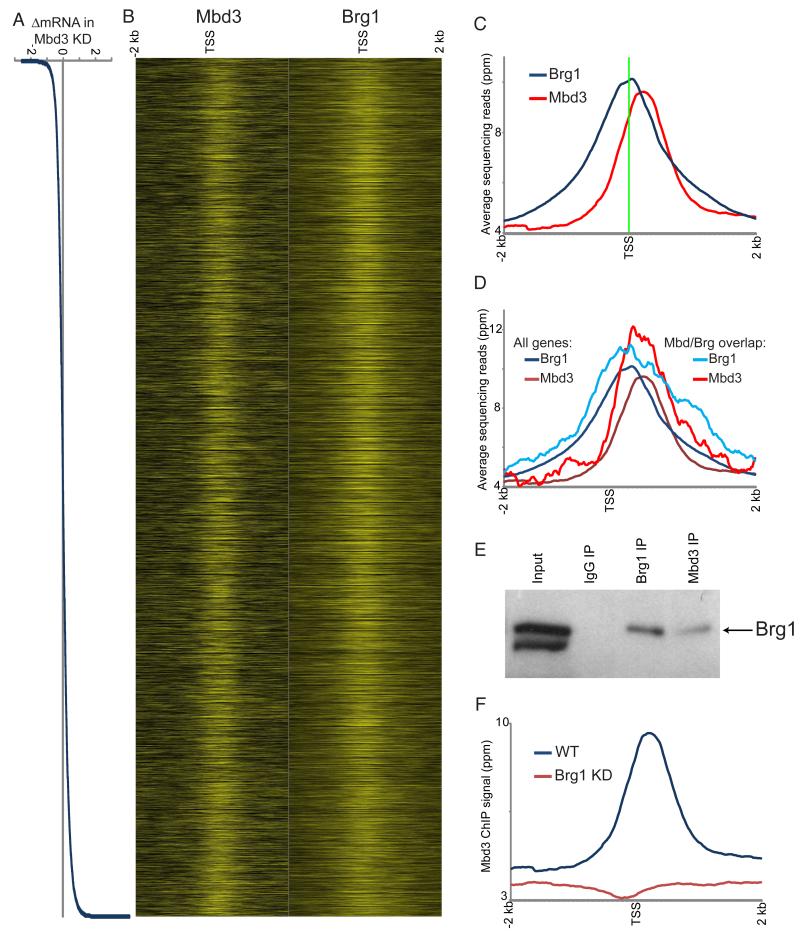
Figure 2. Genome-wide localization of Mbd3.
(A) Mbd3 KD effects on gene expression. Genes are sorted by change in mRNA abundance in Mbd3 KD, shown here in Log2.
(B) Mbd3 was mapped across the genome in ES cells by ChIP-Seq. Left panel: Mbd3 mapping data for 4 kb surrounding the transcriptional start sites (TSS) of 17,992 genes for which Mbd3KD gene expression data were available, with heatmap yellow saturating at 20 ppm normalized abundance. Right panel: published data for Brg1 (Ho et al., 2009a). In both panels, genes are sorted as in (A).
(C) Mbd3 binds downstream of Brg1. Averaged data for all genes in (B) are shown relative to the TSS.
(D) Mbd3 and Brg1 physically associate with antagonistically-regulated genes. Mbd3 and Brg1 data are shown for all genes as in C, or only for genes significantly repressed by Mbd3 and activated by Brg1.
(E) Mbd3 and Brg1 physically associate. Western blots for Brg1 following immunoprecipitation with the indicated antibodies.
(F) Brg1 is required for Mbd3 localization. Mbd3 was mapped genome-wide in Brg1 KD cells, and data for all genes are averaged and plotted as in (C).

