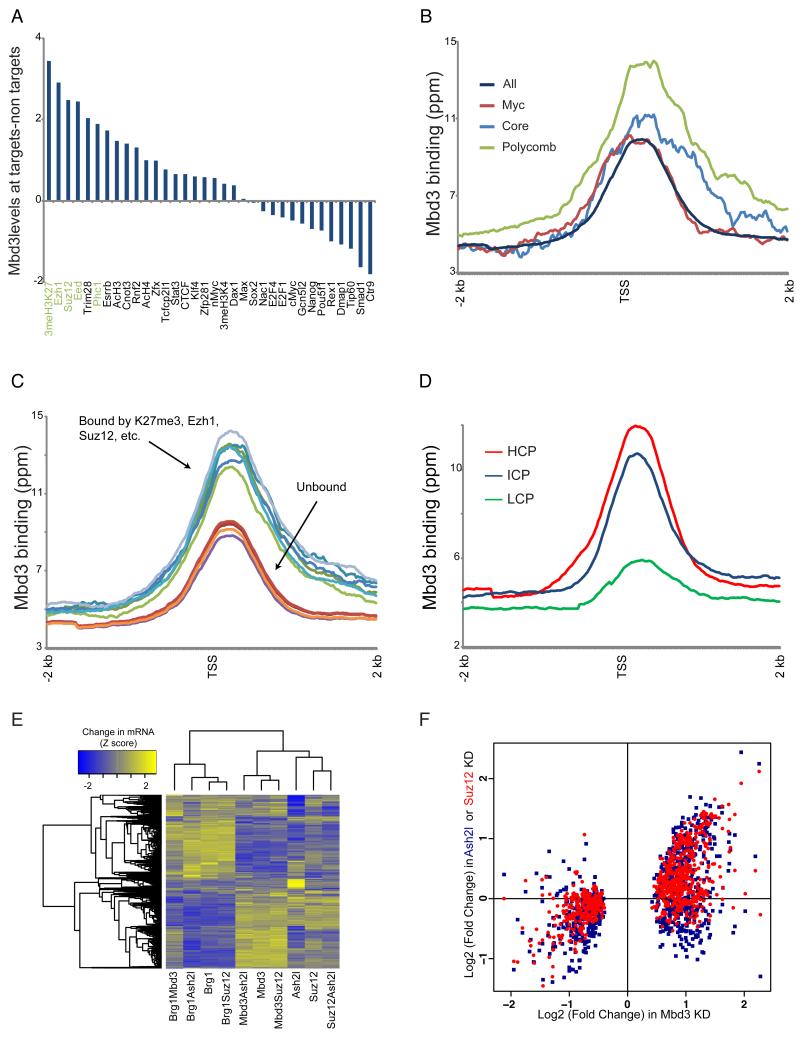
Figure 3. Mbd3 directly regulates Polycomb target genes.
(A) Mbd3 binding at Polycomb target genes. For 34 mapped factors with thresholded binding defined in (Kim et al., 2010), Mbd3 binding levels (mean ChIP signal for 1 kb centered on the +200 position) were calculated for bound and unbound subsets of genes. Genes annotated as unbound by all 34 factors were removed from this analysis. Factors are sorted according to the relative Mbd3 binding at factor targets relative to nontargets.
(B) Mbd3 binding at three ES cell “modules.” Average Mbd3 binding for all genes, and for the three modules defined in (Kim et al., 2010), is plotted relative to the TSS.
(C) Mbd3 binding at Polycomb targets and non-targets. For various Polycomb-related marks, averaged Mbd3 profile is shown for bound and unbound genes.
(D) Mbd3 binds preferentially to high-CpG promoters. Mbd3 binding data are averaged for high, intermediate, and low CpG (HCP, ICP, and LCP) promoters, as defined in (Weber et al., 2007).
(E) Mbd3 KD affects Polycomb targets. Clustered mRNA data for KD of Suz12, Ash2l, Mbd3, or Brg1, and assorted double knockdowns. Genes significantly misregulated in any of the included datasets are shown.
(F) Scatterplot of Mbd3 KD gene expression vs. Ash2l KD and Suz12 KD. Only genes showing significant misregulation in Mbd3 KD are shown.

