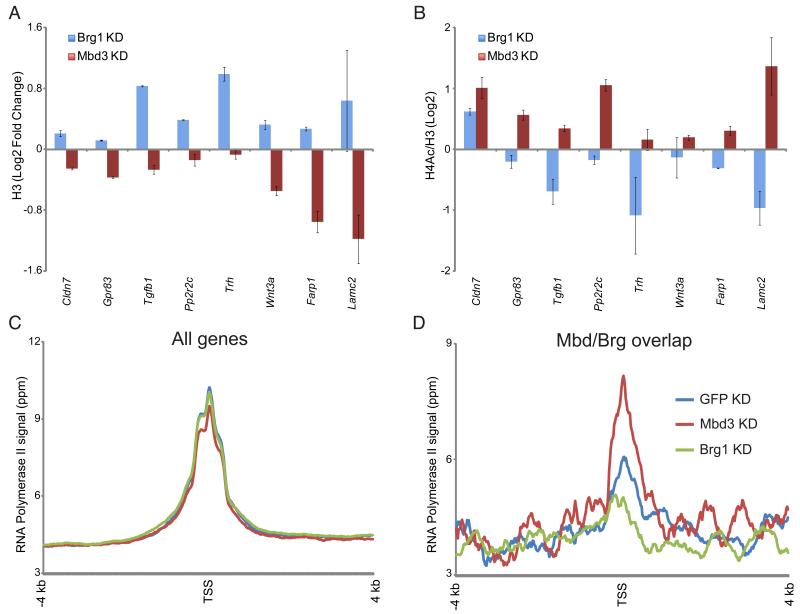
Figure 4. Mbd3 and Brg1 regulate chromatin structure and transcription initiation at target genes.
(A) H3 occupancy at Mbd3/Brg1 targets. H3 occupancy is plotted for control KD, Mbd3 KD, and Brg1 KD.
(B) H4 acetylation at Mbd3/Brg1 targets. As in (A), for H4 acetylation. Data are normalized to nucleosome occupancy (H3 ChIP).
(C) Genome-wide RNA Polymerase II (Pol II) mapping. Average TSS-aligned profiles of Pol II occupancy is shown for all genes for control, Brg1 KD, and Mbd3 KD cells.
(D) Pol II levels at the 5′ end correlate with mRNA abundance changes in Brg1 and Mbd3 KDs. As in (C), but only for genes repressed by Mbd3 and activated by Brg1.

