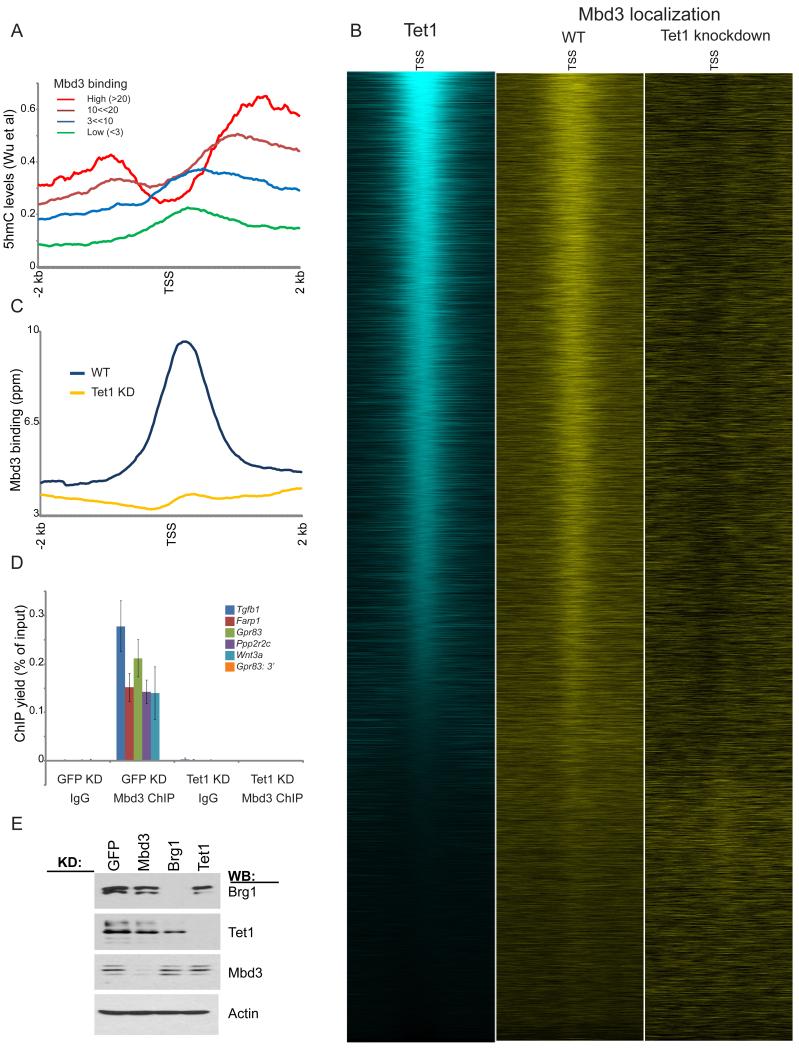
Figure 5. Mbd3 associates with hydroxymethylated regions of the genome.
(A) Mbd3-bound genes are associated with high levels of hydroxymethylation. Average hydroxymethylation data from (Wu et al., 2011a) are averaged for genes with the indicated levels of Mbd3 binding.
(B) Mbd3 colocalizes with Tet1. Left panel: Tet1 (Wu et al., 2011b) mapping data are shown for all named genes, sorted by Tet1 binding levels. Middle and right panels: Mbd3 localization is shown for control and Tet1 KD ES cells.
(C) Mbd3 binding data for control and Tet1 KD are plotted as in Figures 2C-D.
(D) qPCR validation of Mbd3 binding at 6 selected target loci in GFP or Tet1 KD. Shown are mean +/− sem.
(E) Knockdowns of Tet1, Brg1, and Mbd3 do not affect protein levels of the other remaining factors. Knockdowns of the various factors were assayed by Western blot, as indicated.
See also Figure S5.

