Figure 1.
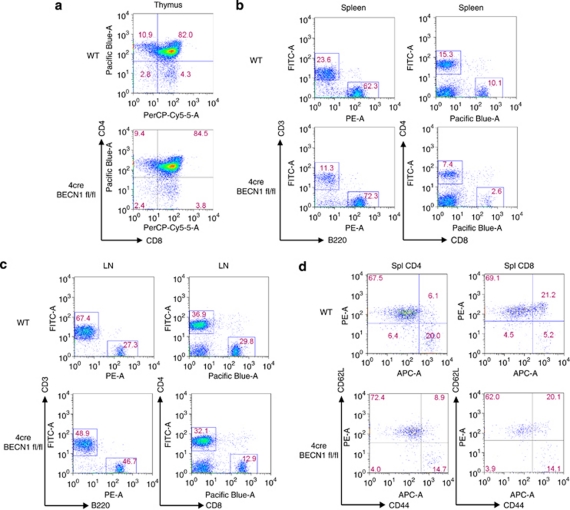
Modest reduction of peripheral CD4+ T cells in 4cre BECN1 fl/fl mice. Flow cytometry analysis of single-cell suspensions from thymus (a), spleen (b) and lymph node (c), which were stained for surface markers CD4, CD8, CD3 and B220. (d) Analysis of naïve and memory T cells (CD4, left; CD8, right), which were stained for CD44 and CD62L

