Figure 2.
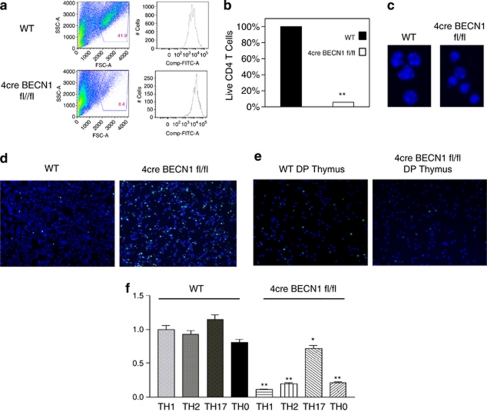
Beclin 1-deficient CD4+ T cells undergo increased levels of apoptotic cell death upon TCR stimulation. CD4+ T cells were isolated from spleens of WT (top) and 4cre BECN1 fl/fl mice (bottom), stained with CFSE and stimulated under Th1 conditions for 72 h. Cell death was assessed by flow cytometry by forward and side scatter gating of blasted lymphocytes (a). The survival of WT cells was set as 100%, and the percentage of live Beclin 1-deficient CD4+ T cells versus WT cells were quantified (b). The morphology of cell nuclei was revealed by fluorescent microscopy after staining cells with Hoechst 33342 dye (blue; c). (d) WT and 4cre BECN1 fl/fl CD4+ T cells were stimulated by anti-CD3 and anti-CD28 for 24 h. TUNEL (green) assay was performed and counter stained by Hoechst 33342 dye (blue). (e) TUNEL analysis was performed for double-positive (DP) and single-positive (CD4+, SP) thymocytes upon anti-CD3 and anti-CD28 stimulation for 24 h. All results are representative of n≥3 independent experiments. (f) Naïve CD4+ T cells were isolated from spleens of WT and 4cre BECN1 fl/fl mice and cultured under Th1, Th2, Th17 and Th0 conditions for 72 h. Cell death was assessed by flow cytometry by forward and side scatter gating of blasted lymphocytes. The percentage of live WT cells in the Th1 condition was set as 100%. Ratio of surviving Beclin 1-deficient CD4+ T cells cultured in other conditions versus the Th1 condition was calculated and shown. Student's t-test was performed to compare WT with Beclin 1-deficient CD4+ T cells cultured in the same conditions. *P<0.05 and **P<0.001. The color reproduction of this figure is available at the Cell Death and Differentiation Journal online

