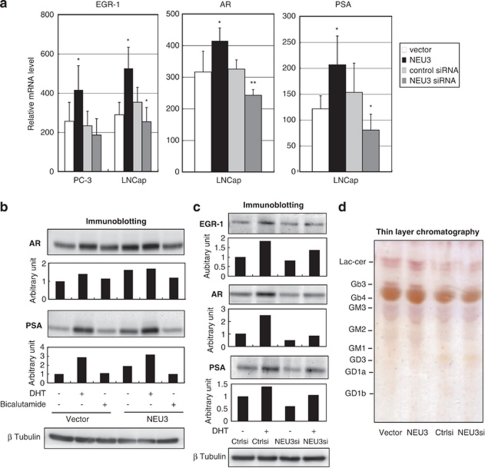
Figure 3.
Altered expression of AR signaling-related molecules by NEU3 in LNCaP cells. (a) Altered mRNA expression of AR signaling-related molecules in NEU3-silencing or -overexpressing cells. *P< 0.05, **P<0.01 compared with control siRNA or vector. EGR-1, AR and PSA levels were assessed by RT–PCR as described in Materials and Methods. (b) Protein levels of AR and PSA in the presence of DHT or bicalutamide in NEU3-overexpressing and control cells as assessed by immunoblotting with respective antibodies. (c) Protein levels of EGR-1, AR and PSA in the presence or absence of DHT in NEU3-silencing or control cells as assessed by immunoblotting. In b and c, the results are representative of three independent experiments. Quantitative data are presented as values relative to those in the cells treated with the vector or siRNA control in the absence of DHT and bicalutamide. (d) Thin-layer chromatography of glycolipids from NEU3-overexpressing and -silencing cells. After development, the glycolipids were visualized with orcinol–H2SO4. Results are representative of three independent experiments

