Table 1.
Conversion (% relative peak-area by GC–MS of extracted reaction mixtures), after 24 h, of substrates 1, 3, 5, and, after 48 h, of substrates 7, 11, 13 and 15 with P450cam-RhFRed mutants in 48-well plate biotransformations.
 | ||||||
| Compounds | P450cam-RhFRed mutants | |||||
| Substrate | Products | Substrate no. | Y96A | Y96F | Y96F/V247A | |
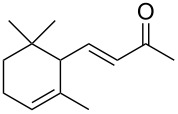 1 |
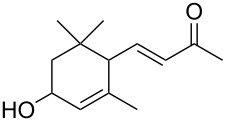 2 |
1 | >99 | >99 | >99 | |
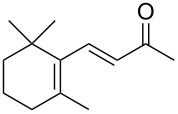 3 |
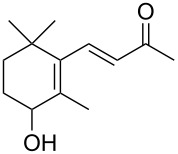 4 |
3 | 94 | 98 | >99 | |
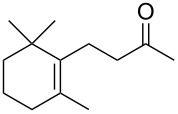 5 |
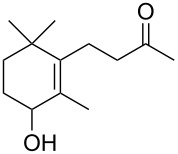 6 |
5 | 64 | 50 | >99 | |
 7 |
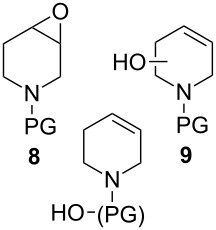 10 |
7a | 12 (8a) | — | — | |
| 7b | 48 (8b) | 26 (8b) | 73 (8b)a | |||
| 7c | 85 (10c)b | 16 (8c) 34 (10c) |
7 (8c) 59 (10c) 31 (10c') |
|||
| 7d | n.c.c | n.c.c | n.c.c | |||
 11 |
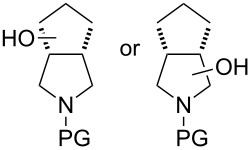 12 |
11a | <2 (u)d | — | — | |
| 11b | 12 (12b) | <2 (u)d | 9 (12b) 15 (12b') |
|||
| 11c | <2 (u)e | n.c.c | 11 (12c) | |||
| 11d | 88 (12d)f | 22 (12d) 69 (u)d |
18 (12d) 82 (u)d |
|||
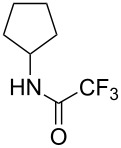 13 |
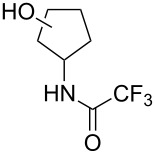 14 |
13 | n.c.c | n.c.c | 18 (14d) 6 (14d') |
|
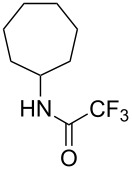 15 |
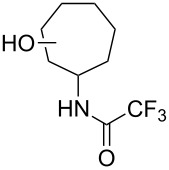 16 |
15 | 15 (16d) 9 (16d') |
11 (16d) 10 (16d') |
15 (16d) 75 (16d') |
|
aOne other product was detected (8%). bOne other product was detected (10%). cn.c. = no conversion. du = unidentified product. eTwo unidentified products. fThree other minor products were detected (12%).
