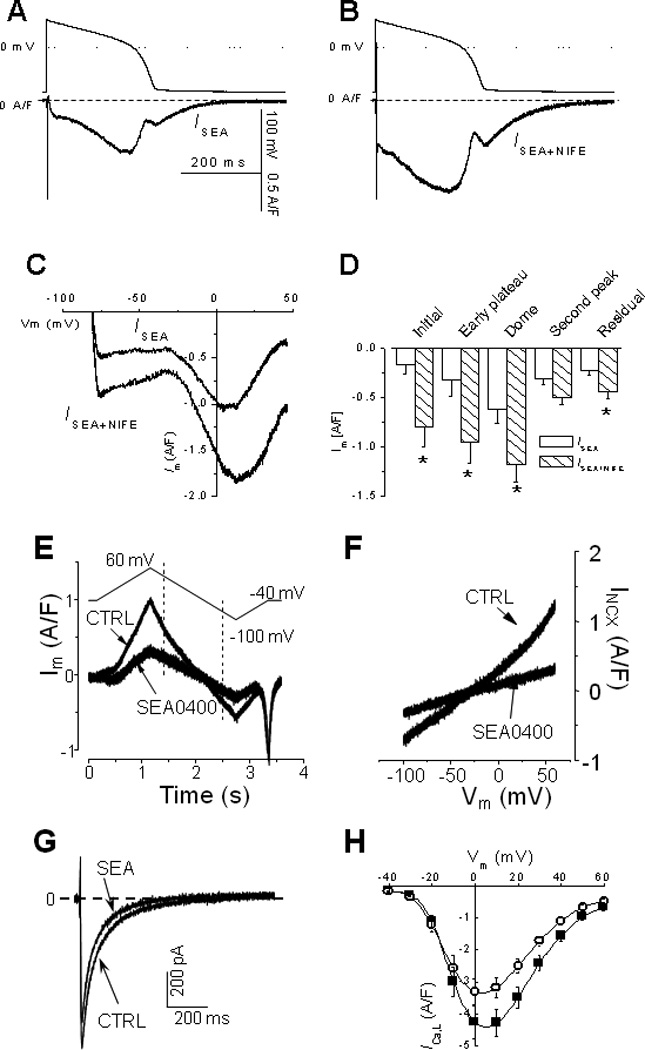
Fig.3.

Panel A shows a representative current recorded with 3 µM SEA0400 (ISEA). When 10 µM nifedipine was added, ISEA+NIFE displays similar characteristics (B). Panel C and D show the instant current-voltage relationship of ISEA and ISEA+NIFE and statistical comparison of data (n=7 cells, t-test, p<0.05*). Standard V-clamp protocols were used to measure the inhibitory effects of 3 µM SEA. Panel E and F show current traces and the I–V relationship of INCX before and after application of SEA. Panel G and H show representative current traces and the I–V relationship of ICa,L before and after application of SEA.
