Fig. 4.
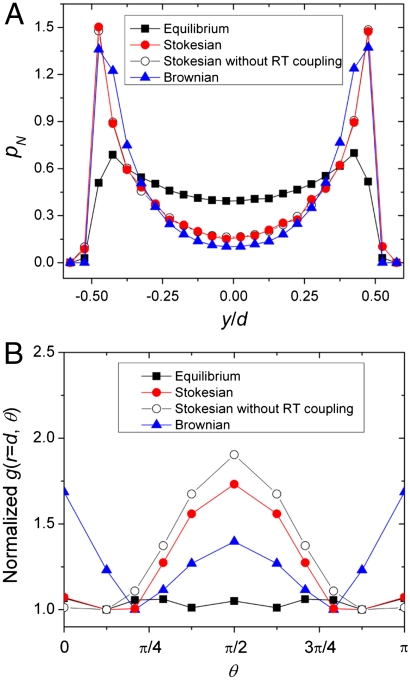
String formation in Stokesian dynamics simulations. (A) shows the probability distribution of particles along y under different simulation conditions. (B) shows the first peak of g(x,z), g(r = d,θ), versus θ. g(r = d,θ) is normalized by its minimal value near π/8. Black squares show the equilibrium structure with Pe = 0. Red disks show the results from Stokesian dynamics simulations with Pe = 50. Blue triangles show results from Brownian dynamics simulations with Pe = 50 after the hydrodynamic couplings between particles have been turned off. Empty circles show results from Stokesian dynamics simulations when the hydrodynamic couplings between the particle rotations and translational motions are turned off. The volume fraction of the sample is chosen such that g(x,z) show comparable values in Stokesian dynamics simulations and in experiments with ϕ = 0.34 samples.

