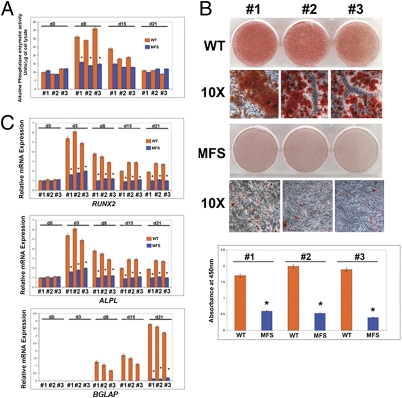
Fig. 2.
Impairment of osteogenic differentiation in MFS cells. (A) Alkaline phosphatase enzymatic activity is significantly reduced in MFS cells. (B) Alizarin red staining reveals lack of mineralization in MFS cells. Histogram below represents quantification of staining. #1, #2, and #3 represent three independent isolations of CD73+ cells. (C) qPCR showing down-regulation of specific osteogenic markers in MFS cells. The relative mRNA level in each sample was normalized to its GAPDH content. Values are given as relative to GAPDH expression.

