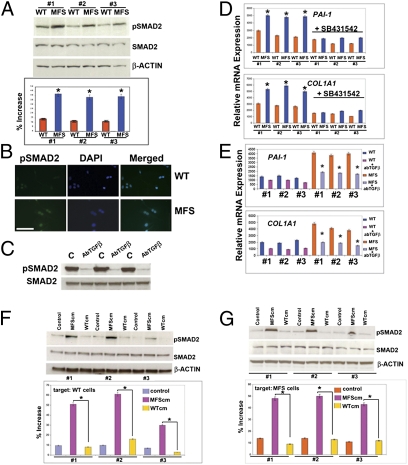
Fig. 3.
Enhanced activation of TGF-β1 signaling in MFS cells. (A) immunoblotting analysis showing a more intense phosphorylation of SMAD2 in MFS cells. To assess for the total amount of endogenous SMAD2 and to control for equal loading and transfer of the samples, the membrane was reprobed with anti-SMAD2 and anti–β-actin antibody. Histogram below represents quantification of phosphorylated SMAD2 protein obtained by the ImageJ program. The relative intensity of each band was normalized to its respective β-actin loading controls. (B) Immunofluorescence using anti-pSMAD antibody detects strong staining in MFS cells compared with WT. DAPI nuclear counterstaining. (Scale bar, 50 μm.) (C) Treatment with pan–TGF-β–neutralizing antibody (1.2 μg/mL) dramatically decreases the endogenous phosphorylated SMAD2 in MFS cells. (D) qPCR analysis reveals up-regulation of PAI-1 and COL1A1 expression in MFS cells; treatment with SB431542 (10 μM) inhibits the up-regulation. (E) Up-regulation of PAI-1 and COL1A1 expression is abrogated by pan–TGF-β–neutralizing antibody. (F) Treatment of WT cells with serum-free conditioned-media collected from MFS cells (MFScm) induces heavy phosphorylation of SMAD2 protein, whereas conditioned-media collected from WT cells (WTcm) does not. Control represents untreated cells. Control for loading and transfer of the samples and densitometry analysis of pSMAD2 bands were performed as above. (G) Similar results are observed on treated MFS cells. Asterisks indicate statistically significant differences: *P < 0.05.

