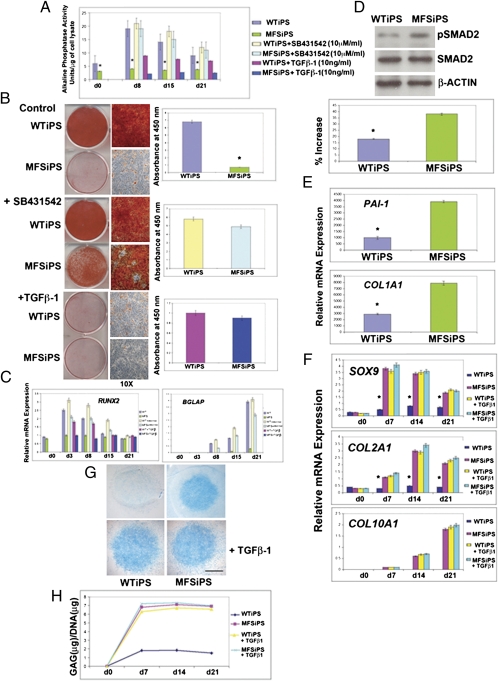
Fig. 6.
MFSiPS cells phenocopy MFS embryonic stem cells. (A) Alkaline phosphatase enzymatic assay detects significantly lower levels of activity MFSiPS. (B) Alizarin red staining showing poor mineralization of extracellular matrix in MFSiPS cells. SB431542 treatment rescues osteogenic differentiation of MFSiPS, whereas addition of TGF-β1 (2 ng/mL) inhibits osteogenesis. (C) qPCR analysis of osteogenic markers RUNX2 and BGLAP. (D) Higher levels of endogenous phosphorylated SMAD2 detected by immunoblotting analysis in MFSiPS cells. Histogram below showing quantification of phosphorylated SMAD2. Control for loading and transfer of the samples were determined as described in Fig. 3. (E) qPCR analysis indicates up-regulation of PAI-1 and COL1A1 expression in MFSiPS cells. (F) qPCR of chondrogenic markers in MFSiPS and WTiPS micromass cultures with or without exogenous TGF-β1. (G) Alcian blue staining indicates that MFSiPS are able to differentiate without TGF-β1 supplement. (Scale bar, 250 μm.) (H) Quantification of GAGs confirming the chondrogenic differentiation of MFSiPS micromass cultured without exogenous TGF-β1. Asterisks indicate statistically significant differences: *P < 0.05.

