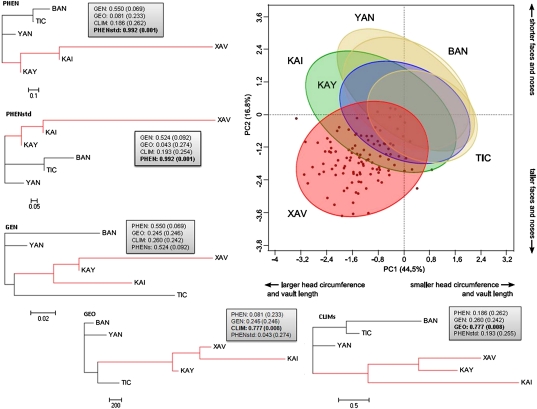
Fig. 1.
First two principal components depicting variation on the sex-standardized cephalometric variables. Ellipses represent the 75% of variation for each group. Red, Xavánte; green, Kaingang; blue, Kayapó; light brown, non-Jê groups, Yanomami, Ticuna, and Baniwa. Neighbor-Joining trees for each of the five distance matrices are also displayed. The Jê-speaking clade is represented in red. Gray boxes provide Mantel correlation scores and associated P values between each matrix and the remaining four ones (CLIM, Climatic; GEN, genetic; GEO, Geographic; PHEN, phenotypic; PHENstd, phenotypic standardized). Statistically significant values are shown in bold. The trees were rooted using the Yanomami.

