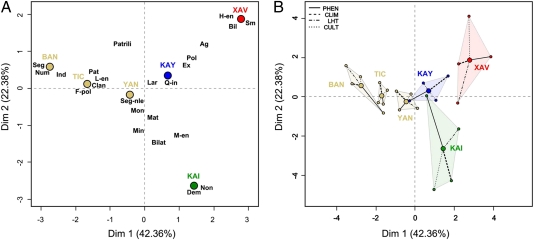
Fig. 3.
MFA results. (A) Plot of populations and sociocultural categories as listed in Dataset S1. (B) “Partial individuals' superimposed representation” representing each population viewed by each group of variables and its barycentre. Red, Xavánte; green, Kaingang; blue, Kayapó; light brown, non Jê groups, Yanomami, Ticuna, and Baniwa. The mean population points in A are here joined to their corresponding partial points, depicting the influence of each set of variables.

