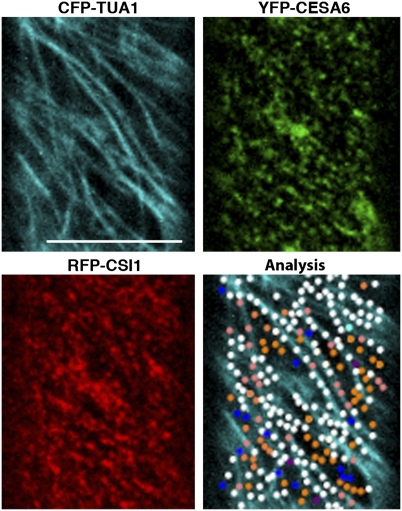
Fig. 5.
Colocalization of CESA complexes, CSI1, and cortical microtubules. Quantification of colocalization pattern in three-channel imaging of epidermal cells expressing CFP-TUA1, YFP-CESA6, and RFP-CSI1 (n = 3 cells from three seedlings). Shown is a representative image from three cells used for colocalization analysis. White dots represent colocalized CFP-TUA1, YFP-CESA6, and RFP-CSI1. Orange dots represent colocalized YFP-CESA6 and RFP-CSI1 but not CFP-TUA1. Pink dots represent colocalized RFP-CSI1 and CFP-TUA1 but not YFP-CESA6. Cyan dots represent colocalized CFP-TUA1 and YFP-CESA6 but not RFP-CSI1. Blue dots represent YFP-CESA6 that did not colocalize with others. Purple dots represent RFP-CSI1 that did not colocalize with others. (Scale bar, 10 μm.)

