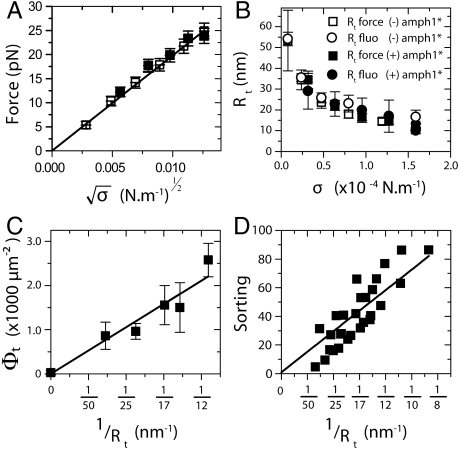
Fig. 3.
The dilute limit. The results presented in this figure correspond to a single GUV with Φv < 50 μm-2. (A) No difference between the tube force as a function of  with protein (□) or without (▪). The linear fit to the force,
  , gives κ = 12 ± 2 kBT. (B) The radius, Rt, versus tension, σ, with protein (empty symbols) or without (full symbols). Radius is deduced either from fluorescence (round symbols) or from force (square symbols) measurements. (C) Amphiphysin density on the tube, Φt, versus tube curvature, 1/Rt. Rt was found from force measurements. A linear fit yields Φt = A/Rt μm-2, where A = 29 ± 2 μm-1. (D) Linear variation of the sorting ratio as a function of 1/Rt. Data correspond to five independent experiments. A fit using Eq. 4 gives
  .
.

